Basics of Technical Analysis
- investeenn
- May 7, 2023
- 2 min read
Technical analysis means data, statistics and some trading patterns that are used for short term trading (3-5 days at max). It is necessary to note that NO form of technical analysis is always applicable or always works, which is why you should NEVER base ur whole trades off on technical indicators. It should include a multitude of factors - including the overall macro economy, the fundamentals of the company etc and technical analysis too.
Candlestick patterns

As shown in this image, a support is a minimum price that a stock hits more than once while a resistance is a maximum price that a stock hits more than once.
More the number of times a stock hits a resistance/support, the more likely it is to rebound upwards/downwards from that support/resistance. This applies very often( of course not all the time) for any kind of candlestick pattern.

This shown here is a CONSOLIDATION. When a stock repeatedly hits supports/resistances it is known as consolidation and eventually it will break out, causing the stock to move up or down (up in this case).

This is a head and shoulders pattern. This is very often seen in many stocks even those with really high market cap. After the pattern, the stock generally plummets downwards.

These are some common triangle patterns.
There are many more patterns that exist in technical analysis. You could research them further online, however I personally think that these basic ones are enough because over time as you get experienced in trading, you will be able to see patterns in the shapes for yourself and it will come intuitively.
Technical Indicators
Moving Averages - These represent the average prices over a specific period of time.
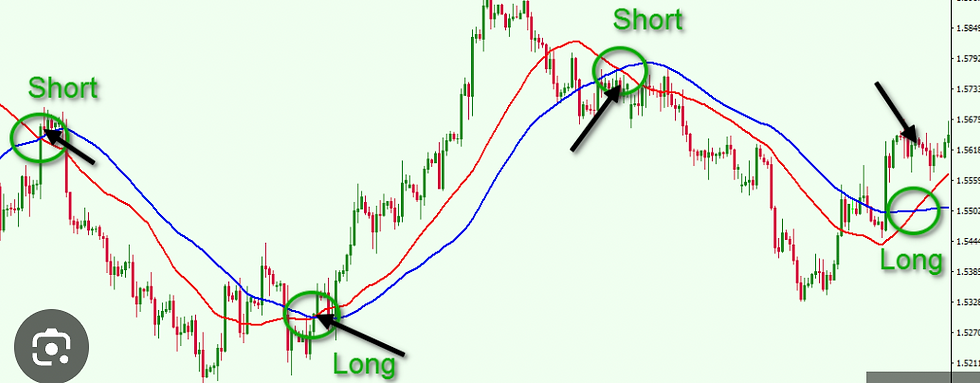
As shown by the diagram, when shorter time moving average moves below the longer one, its a sell signal.
When the longer time moving average moves below the shorter one, its a buy signal.
RSI(Relative Strength index) - RSI is a scaled value from 0 to 100 that indicates how oversold or overbought a stock is.

Buy when stock price exits oversold(from down to up)
Sell when price exits overbought(from up to down)
There are tons of other technical indicators that use statistics in order to predict future prices. However, it is necessary to note that it isn't always reliable as other macroeconomic or firm-related factors are of greater importance.
So, in conclusion, technical analysis may be useful in the short term, and it does work very often. However, you shouldn't rely on it too much.
Keep investing.

Comments